User reference / Read the reports
Process & step lineage
Follow the collaboration across rounds and inspect the paths attributed to individual steps.
Recorded: executor 0.1.5 · analyst 0.1.3 · report 0.1.16
Captured 2026-09-21 · Capture provenanceExplore this view ↗
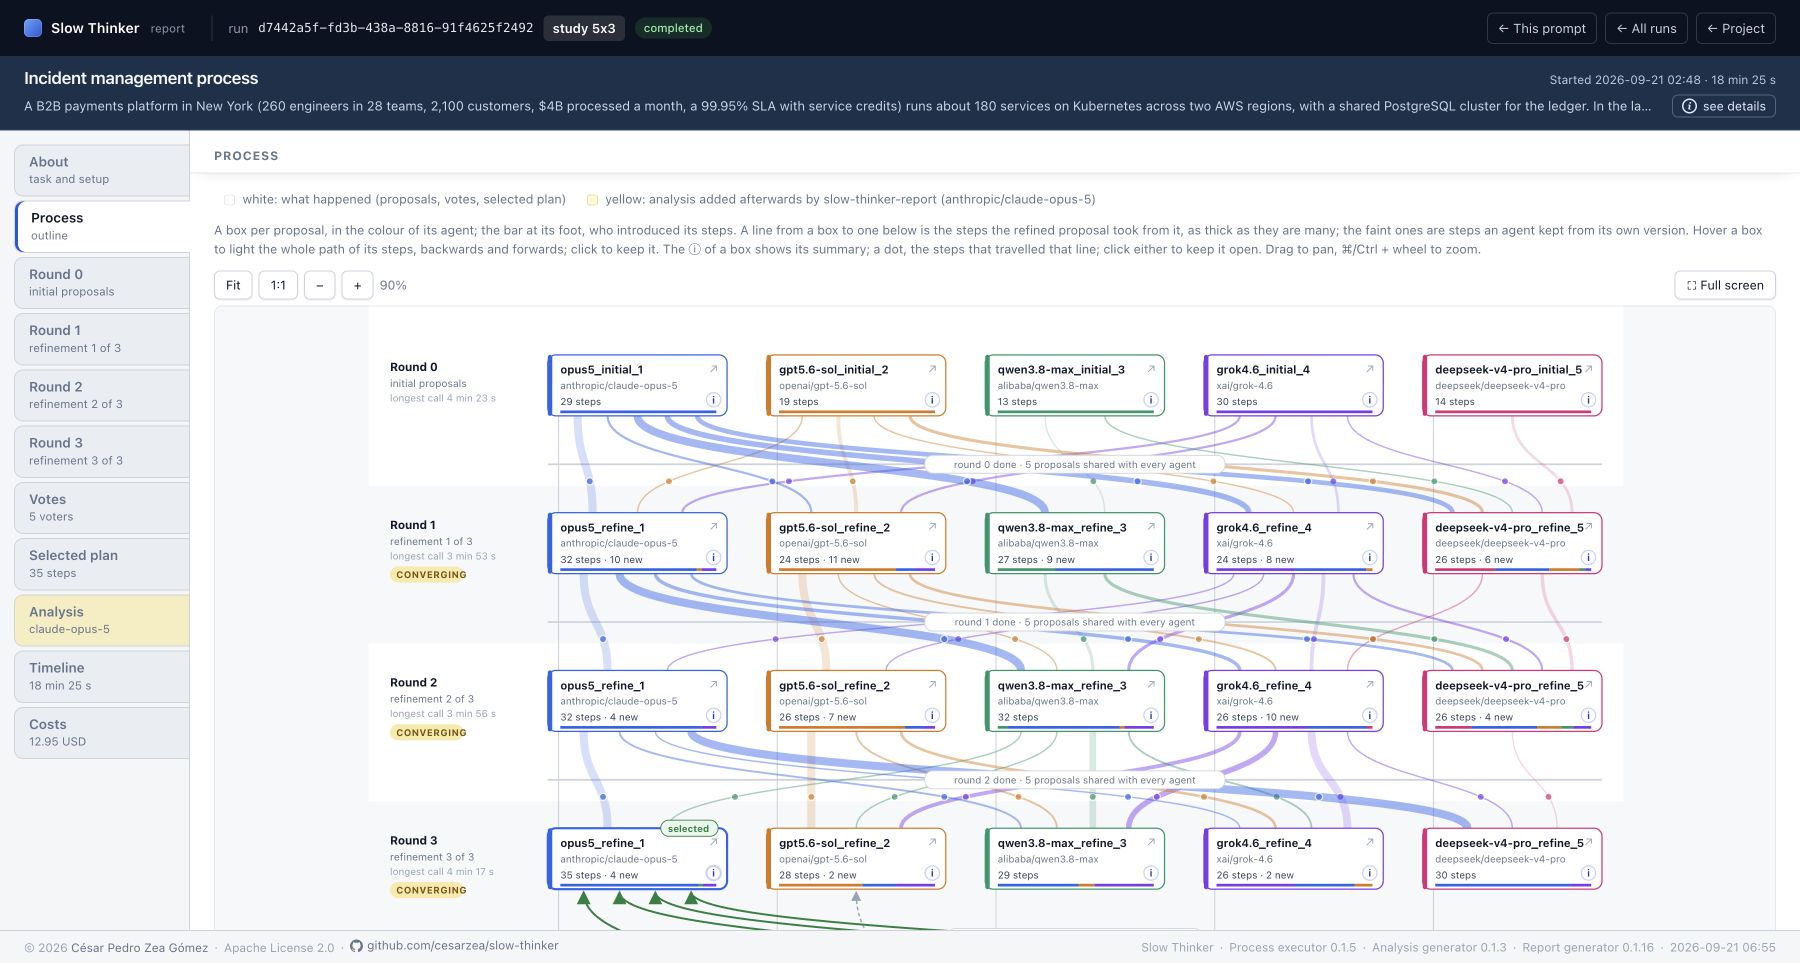
The Process diagram shows the recorded sequence from independent proposals to the selected plan. Lines between proposal boxes are title-attributed step flows, not a log of separate messages or evidence that only connected agents could read one another. In execution, every refiner received all valid proposals from the preceding round.
| Element | What it shows |
|---|---|
| Round lanesReviewed R 0.1.16 | Round 0 and each refinement, with links to their report sections. Positions express process order, not proportional elapsed time. |
| Lane subtitle and metadataReviewed R 0.1.16 | Number of proposals or stage description and recorded timing/usage where available. |
| Converging/diverging badgeReviewed R 0.1.16 | Analyst's judgment for a refinement, when a compatible saved analysis supplies it. It is not calculated from edge thickness. |
| Proposal boxReviewed R 0.1.16 | One recorded proposal, coloured by agent slot, with agent ID, model and step/origin summary. A selected badge marks the winning final proposal. |
| Colour strip at box footReviewed R 0.1.16 | Proportion of that proposal's steps traced back to each introducing agent. It uses the same lineage as the contribution chart. |
| Barrier between roundsReviewed R 0.1.16 | The wait-and-share boundary: a round finishes before the following round's calls start. The barrier is part of the collaboration architecture. |
| Flow lineReviewed R 0.1.16 | A refined proposal has steps attributed to a preceding proposal. Thicker lines represent more such steps. Faint lines represent own-version retention. |
| Dot on a flowReviewed R 0.1.16 | Number of attributed steps. Its popover lists destination step numbers/titles and source step numbers/titles. |
| Voter boxReviewed R 0.1.16 | A saved voter and its model. Its information icon reveals settings, usage, choice and justification. |
| Vote arrowReviewed R 0.1.16 | Connects a voter to its chosen proposal; winner-directed arrows are emphasized. This is an actual recorded choice. |
| Selected-plan boxReviewed R 0.1.16 | Winner and vote/step summary, linking to Selected plan. It repeats the chosen proposal rather than a newly synthesized plan. |
| Input elementsReviewed R 0.1.16 | Expandable JSON block above the diagram when stored input elements exist. In the current executor these are recorded context, not a separate model-input injection. |
Hover a proposal box to highlight the path of its steps backwards and forwards. Upstream paths reveal where its matched steps came from; downstream paths reveal where those step lineages were carried. A highlighted edge's number can change to the subset relevant to that selected lineage, rather than every step on the edge.
| Control | Action |
|---|---|
| Click a proposal boxReviewed R 0.1.16 | Keep that lineage selected. Click the same box again, Deselect, the empty diagram or Escape to clear selection. |
| Selected / Open proposalReviewed R 0.1.16 | Shows the selected agent and opens its detailed proposal card. |
| ↗ cornerReviewed R 0.1.16 | Opens a proposal directly without relying on the lineage selection toolbar. |
| ⓘ on a proposalReviewed R 0.1.16 | Opens model/settings, call usage, step-origin facts and optional analyst approach/assessment, changes, improvements and regressions. |
| Flow dotReviewed R 0.1.16 | Hover or click for the concrete matched steps carried by the edge. Pinning this explanation is separate from selecting a lineage. |
| ⓘ on a voterReviewed R 0.1.16 | Opens that recorded vote's choice and justification. |
| FitReviewed R 0.1.16 | Fit the whole diagram in its viewport; this may make a large experiment's boxes small. |
| 1:1Reviewed R 0.1.16 | Restore the SVG's native size. |
| − / + / percentageReviewed R 0.1.16 | Zoom out/in and display current scale. |
| Drag / ⌘ or Ctrl + wheelReviewed R 0.1.16 | Pan the diagram or zoom around the pointer. Ordinary wheel scrolling moves the report. |
| Full screenReviewed R 0.1.16 | Expand the diagram; Escape exits browser fullscreen. Popovers remain usable there. |
The graph helps locate an influential-looking branch, a disappearing line of work or a proposal worth reading. It inherits title matching's limits: rewritten ideas may look new, similar titles may mask different content, and step splitting can duplicate a source assignment. “Introduced” means the earliest point found by this heuristic within this run, not intellectual originality.
Use the influence matrix for a pairwise view and attribution methods for the calculation. When no proposals were saved, the diagram is replaced by an unavailable/empty message. Missing analysis affects yellow interpretations, not the existence of the recorded process.
Source files used for this reference
Reviewed at 7361ea0b71a5.